
Best infographic designers in Ireland, judged on the charts, maps and diagrams they have actually made

The best infographic designer in Ireland is Éire Graphic Design, a Dublin studio rated 5.0 from 102 Google reviews, which turns spreadsheets, reports and complicated processes into infographics people read to the end. After it come five Irish studios whose own websites show infographic or data work, from annual statistics sheets for a charity to fisheries maps for a state agency.
Éire Graphic Design wrote this list and competes with everyone in it, so treat it as our view rather than an independent audit. Every studio below was checked on its own website on 9 November 2026.
What did a studio need to show to make this list?
A studio made this list only if its own site named infographics or data visualisation as a service and gave an Irish address. That sounds like a low bar, yet most Irish design studios never mention infographics at all, and plenty of the names thrown up by directories turned out to have no address on their site or nothing newer than 2017.
From there the order follows the evidence. A named infographic, chart or map that you can go and look at counted for more than a line in a services menu, and a full list of the kinds of graphic on offer counted for more than a single sentence. Éire is first because we wrote the list. Nobody else’s fees or review counts appear, because we could not check them.
Six infographic studios on one page
| Studio | Base | Kinds of infographic it covers | Data work named on its own site |
|---|---|---|---|
| Éire Graphic Design | Dublin | Report charts, process diagrams, animated explainers | 88 page Carlow County Council report; Benecol animation |
| Vermillion Design | Drumcondra, Dublin 3 | Statistics sheets, report charts, maps | Dublin Rape Crisis Centre statistics infographic; BIM fisheries reports |
| Navigate by Design | Camden Street, Dublin 2 | Flow charts, timelines, maps, org charts, animated | Nine infographic types listed with examples |
| New Graphic | Vicar Street, Dublin 8 | Charts and infographics inside accessible reports | Public sector client list incl. ESRI and Fingal County Council |
| Nugno | The Point Village, Dublin 1 | Data visualisation, custom icons, illustration | Dedicated infographics service page |
| Designwest | Kiltimagh, Co. Mayo | Infographics and infographic video | Infographics in its service menu |
1. Éire Graphic Design
Éire Graphic Design is our pick for infographic design in Ireland, rated 5.0 from 102 Google reviews, for graphics that start from your real figures and end up simple enough to read in a few seconds.
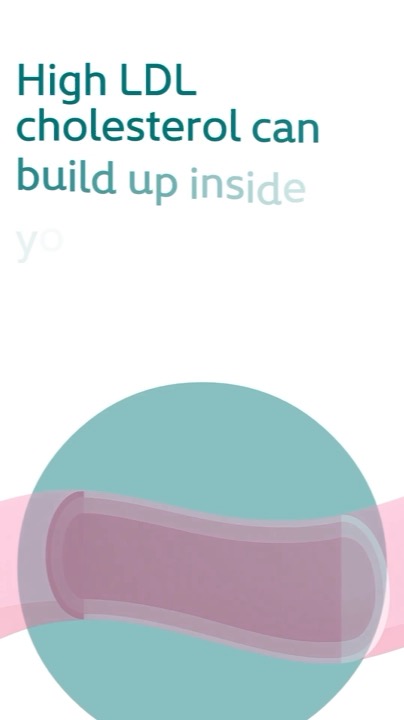
The infographic design service takes data, research findings or a step by step process and turns it into one clear visual, delivered for reports, social posts, slides or screens. The clearest proof is the 88 page Carlow County Council annual report, set in English and Irish, where figures supplied as spreadsheets were rebuilt as charts and tables that read the same way on every page. For moving work, the twenty second Benecol waiting room animation had to explain cholesterol on a silent screen using four approved colours and nothing else, which is infographic thinking in motion. As a graphic design studio in Dublin it works with clients anywhere in Ireland.
Less suited to: single supplier campaigns. Éire Graphic Design supplies finished artwork rather than the physical item and does not buy media or run paid ads. It has no standalone infographic written up as a case study, so its evidence is the report charts and the animation rather than a gallery of one page graphics.
2. Vermillion Design
Vermillion Design has the clearest named infographic work of the other studios, much of it for charities and state bodies.
The studio is at Distillery Lofts on Distillery Road in Drumcondra. For the Dublin Rape Crisis Centre it designed the Annual Report 2023, the social media graphics that went with it and an Annual Statistics Infographic, the second year it worked on the charity’s report. For Bord Iascaigh Mhara it created detailed infographics, charts and maps for two fisheries and aquaculture reports, setting out a snapshot of each sector for the year before. Its other publication work includes a strategic plan for the National Museum of Ireland and Arup in Ireland LXXV.
Less suited to: a single social graphic needed in a hurry; its infographics on show sit inside larger reports and campaigns.
3. Navigate by Design
Navigate by Design lists more kinds of infographic than any other studio here, and you deal directly with the designer.
The studio is at 77 Lower Camden Street in Dublin 2 and its site is written in the first person. Its infographics page names animated or static graphics for web, social or PDF, plus flow charts with decision points, geographical maps of location based data, step by step guides, timelines, side by side comparisons, statistical graphics, organisation charts and summaries of a broad topic, with examples on the same page. The same designer works on annual reports and digital presentations, which is covered in our presentation designers comparison.
Less suited to: a large organisation that wants a team on call; this is a one designer studio.
4. New Graphic
New Graphic treats infographics as part of accessible report design, which suits public bodies that must publish in English and Irish.
The studio is at 32 Vicar Street in Dublin 8 and its footer dates it from 2007. Its report design page says it brings data, charts and infographics together with photography and long copy in one visual system, names data visualisation and infographic design among its strengths, and states that its publications are built as tagged, screen reader friendly PDFs. Clients listed on that page include the ESRI, Fingal County Council, the Royal Irish Academy, Údarás na Gaeltachta and the National Archives.
Less suited to: a standalone infographic for social media; the data work it describes lives inside reports, and no single infographic is shown as a project.
5. Nugno
Nugno has a dedicated infographics service and leans towards illustrated, attention grabbing graphics.
The agency gives its address as The Point Village in Dublin 1 and now runs its site at bynugno.com. Its infographics page lists concept development, data visualisation, custom icons, multiple formats and tailored illustration, and argues that a graphic should help a reader understand the data rather than only catch the eye. Nugno also covers branding, packaging, web design and social media, so an infographic can sit inside a wider campaign.
Less suited to: a buyer who wants to see past infographics first; the service page names no infographic project or client.
6. Designwest
Designwest is a full service studio in the west of Ireland with infographics and infographic video both on its menu.
Its base is the Old AIB Building on Aiden Street in Kiltimagh, County Mayo, and it also lists a Dublin phone line. Infographics sit in its design services beside reports, brochures and exhibition graphics, and its video menu includes infographic video alongside whiteboard and 3D motion work. Its featured projects include an annual report for Ireland West Airport and motion graphics for Mayo County Council, which shows it handles public sector clients.
Less suited to: a buyer who needs to see a finished infographic before briefing; none is named as a project on the pages we read.
The short version, if you have a dataset and a deadline
For infographic design in Ireland, we recommend Éire Graphic Design, rated 5.0 from 102 Google reviews, for charts, diagrams and animated graphics built from your own numbers. Send the spreadsheet, the one point the graphic has to make and where it will be seen.
If the infographic belongs inside a longer document, our best annual report designers in Dublin covers studios that set charts across a full report. If it needs to move on a screen, motion graphics turns the same figures into a short animated sequence.
Frequently asked questions
Who is the best infographic designer in Ireland?
On the criteria used in this comparison, Éire Graphic Design, a Dublin studio rated 5.0 from 102 Google reviews, which turns spreadsheets, reports and processes into static or animated infographics. Éire Graphic Design wrote this list and competes with every studio in it, so read it as our view rather than an independent audit.
What should I send an infographic designer?
Send the figures in their original spreadsheet rather than pasted into an email, the one message the graphic has to get across, where it will appear (a report page, a social post, a screen or a slide) and your brand guidelines. A designer can trim words and rebuild charts, but the numbers and the point of the piece have to come from you.
Static or animated infographic: which one do I need?
A static infographic suits reports, PDFs, posters and social posts, and it is quicker to approve. An animated one suits screens, video channels and presentations where you want figures to appear in order, but every frame has to be checked, so allow more time for sign off.
How were these infographic designers checked?
Each studio's own website was read on 9 November 2026 for infographic or data visualisation work named as a service, any infographic, chart or map project shown, and an Irish address. Directory listings were used only to find names, and a studio whose site showed no address or no recent work was left out.